OpenTelemetry를 활용한 가시성 확보

분산 트레이싱 오픈소스인 Pinpoint 사용중이였으나 hbase의 운영의 어려움 (고사양 인스턴스, zookeeper까지 최소 6대 이상 필요, 네트워크등 지연, 오류 발생시 복제가 깨지면 복구가 매우 힘들어 담당자가 hbase를 초기화하여 매번 다시 실행)과 PHP, Python등 non jvm기반에서도 가시성 확보를 위해 OpenTelemetry에 대해서 공부해보고 실제 환경과 유사한 시나리오를 계획하여 코드를 작성해 보았다.
프로젝트 개요 & 기능
- Observability 확보를 위하여 Application Log, Distributed Tracing, Metrics 수집
- Client -> API Gateway -> Product Micro Server -> PostgreSQL, Kafka로 추적, 로그 구현
- Grafana Dashboard 시각화 구현
아키텍처 & 기술 스택
                  +----------+
                  |          |
                  |  Client  +
                  |          |
                  +----------+
                        |
                        |                                                 +-----+
            +----------v-----------+         +-----------------------+    |Kafka|
            | API G/W              |         | Product Server        |    +-----+
            |                      +--------->                       |    +-----+
            |  OpenTelemetry Agent |         |  OpenTelemetry Agent  |    |Redis|
            +----------+-----------+         +------------+----------+    +-----+
                        |                                  |              +-----------+
                        |                                  |              |PostgreSQL |
                        |                                  |              +-----------+
                        |                                  |
                        |     +------------------------+   |
                        |     |                        |   |
                        +----->OpenTelemetry Collector <---+
                              |                        |
                              +-----------+------------+
                                          |
                                          |
                                          |
             +----------------------------+-----------------------------+
             |                            |                             |
             |                            |                             |
   +---------v------------+     +---------v------------+     +----------v--------+
   |        Tempo         |     |        Loki          |     |     Prometheus    |
   |                      |     |                      |     |                   |
   |  Distributed Tracing |     |   Application Logs   |     |  Metric, Actuator |
   +----------^-----------+     +----------^-----------+     +----------^--------+
              |                            |                            |
              |                            |                            |
              |                            |                            |
              +----------------------------+----------------------------+
                                           |
                                           |
                                           |
                                 +---------+---------+
                                 |     Grafana       |
                                 |                   |
                                 |   DashBoard       |
                                 +---------^---------+
                                           |
                                           |
                                           |
                                           |
                                           |
                                           |
                              +------------+--+
                              |               |
                              |  Developer    |
                              |               |
                              +---------------+
기술스택
- Springboot 3.5.3
- SpringCloud 1.1.7
- JDK 24
- Kotlin 2.2.0
- Gradle 8.14
- Embedded Tomcat + Virtual Thread
- Spring Data JPA
- PostgreSQL
- kafka
- Prometheus
- Tempo
- Loki
- Grafana
- OpenTelemetry Collector
- Docker Compose
프로젝트 구조
- Gradle Multi Module을 활용하여 Gateway모듈과 Product모듈을 분리
Observability/
├── docker/
│   ├── docker-compose.yml # 어플리케이션 시작전 docker compose up 실행
│   ├── grafana/
│   ├── loki/
│   ├── otel-collector/
│   ├── prometheus/
│   └── tempo/
├── gateway/
│   ├── build.gradle.kts
│   └── src/
│       ├── main/
│       │   ├── kotlin/
│       │   │   └── com/
│       │   │       └── ayun/
│       │   │           └── gateway/
│       │   │               └── GatewayApplication.kt
│       │   └── resources/
│       │       ├── application.yml
│       │       └── logback-spring.xml
└── product/
    ├── build.gradle.kts
    └── src/
        ├── main/
        │   ├── kotlin/
        │   │   └── com/
        │   │       └── ayun/
        │   │           └── product/
        │   │               ├── config/
        │   │               │   ├── KafkaConfiguration.kt
        │   │               │   └── TransactionHandler.kt
        │   │               ├── entity/
        │   │               │   ├── BaseEntity.kt
        │   │               │   └── Product.kt
        │   │               ├── event/
        │   │               │   ├── ProductConsumer.kt
        │   │               │   └── ProductEventListener.kt
        │   │               ├── repository/
        │   │               │   └── ProductRepository.kt
        │   │               ├── service/
        │   │               │   └── ProductService.kt
        │   │               ├── vo/
        │   │               │   └── ProductEvent.kt
        │   │               └── ProductApplication.kt
        │   └── resources/
        │       ├── application.yml
        │       ├── data.sql
        │       └── logback-spring.xml
- Observability: 마이크로서비스 관찰 가능성을 위한 루트 프로젝트
- docker: Grafana, Loki, Prometheus, Tempo 등 모니터링 스택 설정
- gateway: API 게이트웨이 서비스 (상품 서버로 라우팅)
- product: 상품 마이크로서비스 (Kafka 이벤트 처리 포함)
코드
Gateway 모듈
이 모듈의 경우 /products/** -> product로 라우팅만 하는 역할
spring:
  cloud:
    gateway:
      server:
        webmvc:
          routes:
            - id: product-domain
              uri: http://localhost:8081
              predicates:
                - Path=/products/**
Product 모듈
- 서버 기동시 샘플 상품 데이터를 입력하도록 구성
- ProductApplication.kt에서 상품 조회 router, handler를 구현
- ProductService.kt에서 상품번호로 상품 상세 조회 JPA 구현, 조회수 업데이트를 위한 이벤트 발행
class ProductService(
    private val productRepository: ProductRepository,
    private val eventPublisher: ApplicationEventPublisher,
) {
    private val log = LoggerFactory.getLogger(ProductService::class.java)

    fun getAllProducts(): List<Product> = productRepository.findAll()

    fun getProductById(productId: Long): Product? {
        log.debug("상품 조회 - ID: {}", productId)
        val product = productRepository.findById(productId).orElse(null)

        // 이벤트 발행
        if (product != null) {
            eventPublisher.publishEvent(ProductEvent(productId))
        }

        return product
    }
-
이벤트 리스너에서는 카프카(product-events)로 토픽 발행
class ProductEventListener(
    private val kafkaTemplate: KafkaTemplate<String, Any>,
) {
    private val logger = LoggerFactory.getLogger(ProductEventListener::class.java)

    @EventListener
    @Async
    fun productEventListen(event: ProductEvent) {
        kafkaTemplate
            .send("product-events", event)
            .whenComplete { result, _ ->
                logger.debug("토픽 발행 결과 : {}", result)
            }.exceptionally {
                val message = "상품 이벤트 토픽 발행 실패 productId : ${event.productId}"
                logger.error(message)

                throw RuntimeException(message)
            }
    }
}
Trace 설정 (Agent방식)
- Idea실행시 실행/디버그 구성으로 가서 VM옵션에 OpenTelemetry Agent 추가
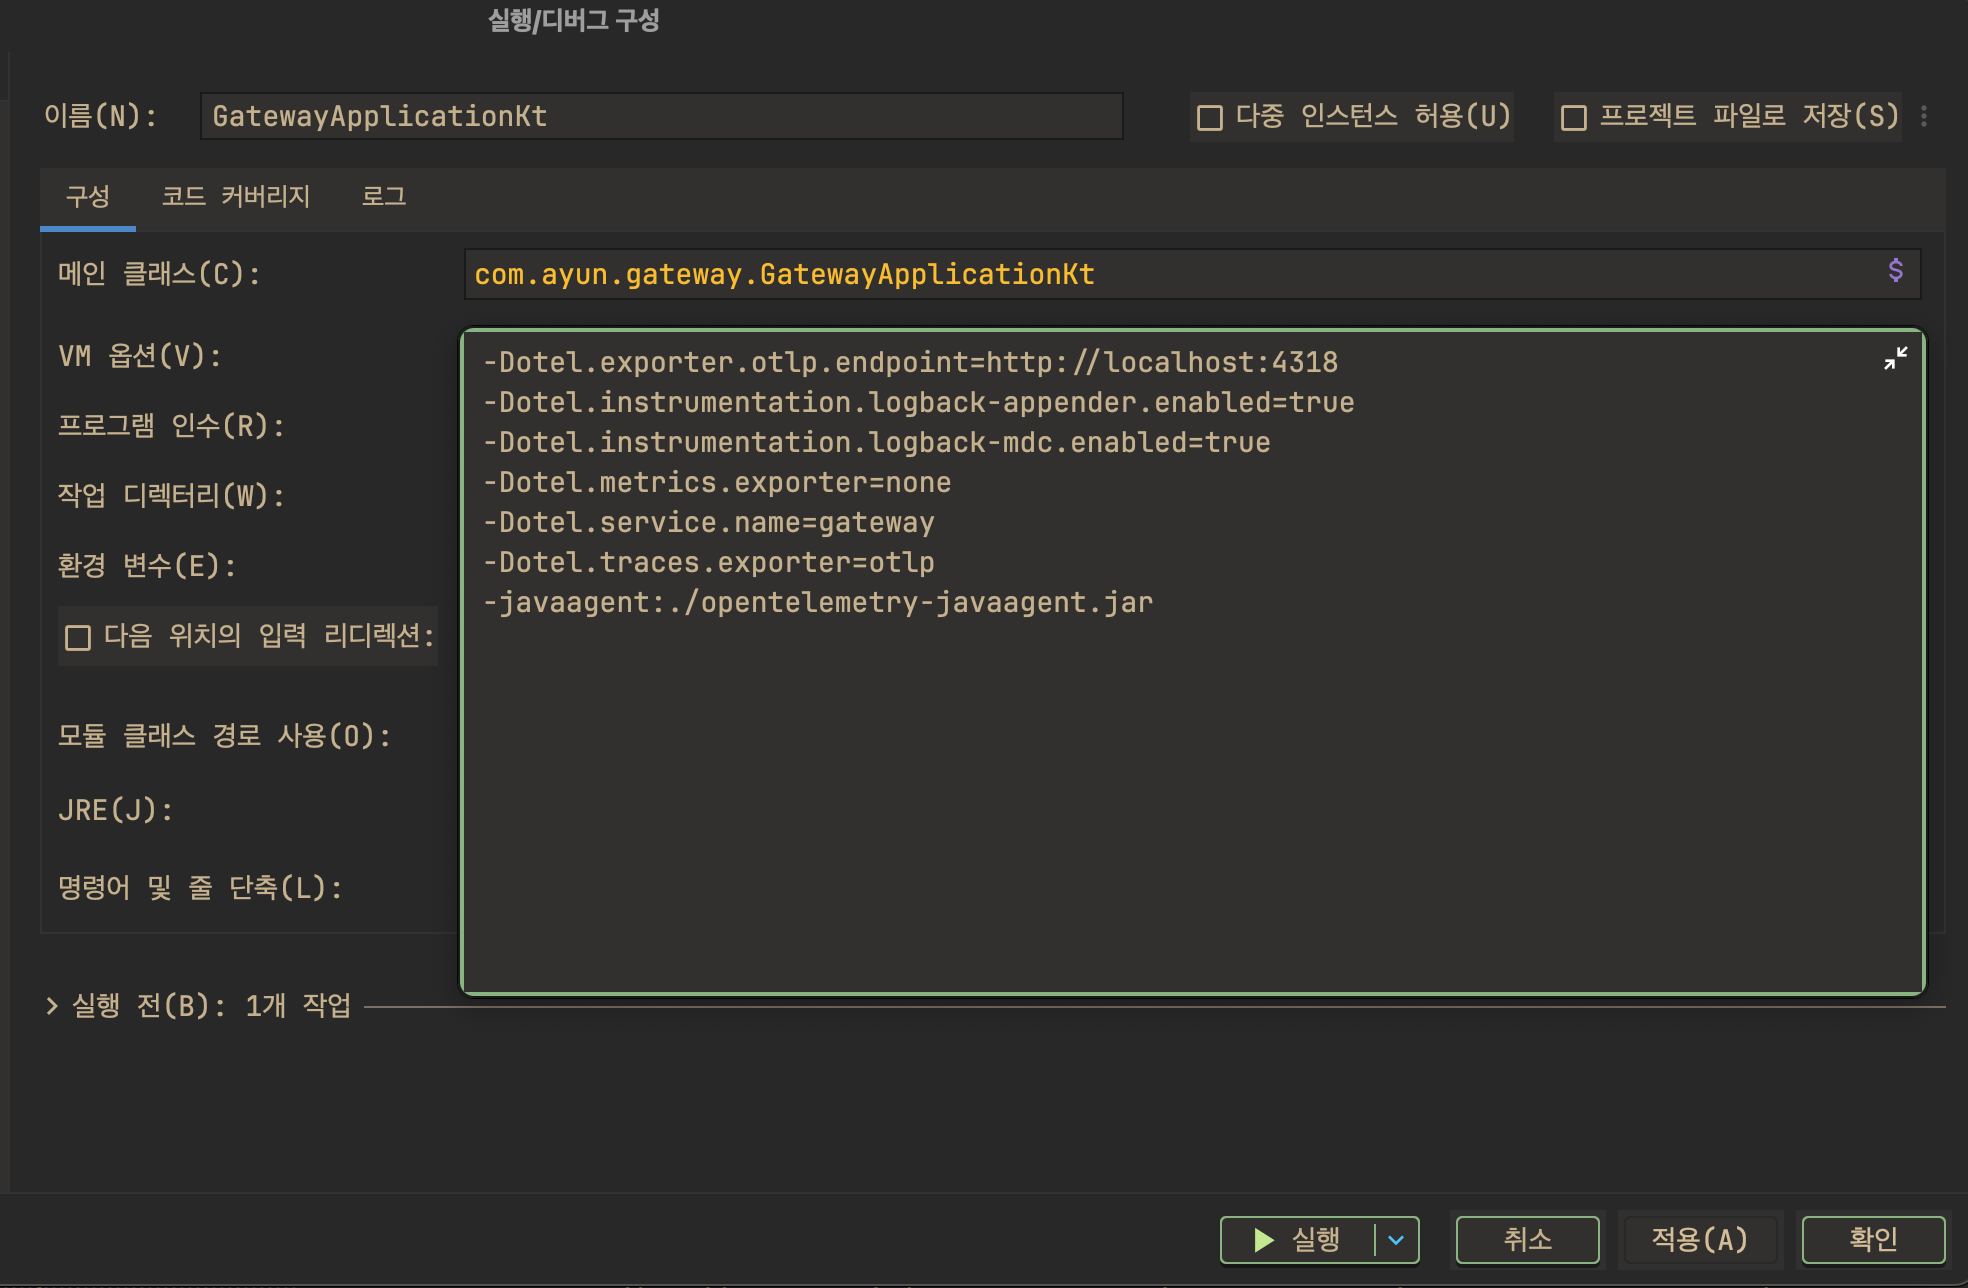
  -Dotel.exporter.otlp.endpoint=http://localhost:4318
  -Dotel.instrumentation.logback-appender.enabled=true
  -Dotel.instrumentation.logback-mdc.enabled=true
  -Dotel.metrics.exporter=none
  -Dotel.service.name=gateway
  -Dotel.traces.exporter=otlp
  -javaagent:./opentelemetry-javaagent.jar
Log 설정 (Loki)
logback-spring.xml에 appender추가
    <!-- Loki Appender -->
    <appender name="LOKI" class="com.github.loki4j.logback.Loki4jAppender">
        <http>
            <url>http://localhost:3100/loki/api/v1/push</url>
            <timeout>30000</timeout>
            <connectionTimeout>5000</connectionTimeout>
        </http>
        <format>
            <label>
                <pattern>
                    service=${SPRING_APPLICATION_NAME:-product},
                    host=${HOSTNAME:-localhost},
                    level=%level,
                    thread=%thread
                </pattern>
            </label>
            <message>
                <pattern>
                    {
                    "timestamp": "%d{yyyy-MM-dd HH:mm:ss.SSS}",
                    "level": "%level",
                    "thread": "%thread",
                    "logger": "%logger{36}",
                    "traceId": "%X{traceId:-}",
                    "spanId": "%X{spanId:-}",
                    "message": "%message",
                    "exception": "%ex"
                    }
                </pattern>
            </message>
        </format>
        <batchSize>1000</batchSize>
        <batchTimeout>10000</batchTimeout>
    </appender>

    <!-- Root Logger -->
    <root level="INFO">
        <appender-ref ref="CONSOLE"/>
        <appender-ref ref="LOKI"/>
    </root>
Metric 설정
application.yml에 actuator 설정 추가
management:
  endpoints:
    web:
      exposure:
        include: health,info,metrics,prometheus,env,beans,configprops
      base-path: /actuator
  endpoint:
    health:
      show-details: always
      show-components: always
    metrics:
      enabled: true
    prometheus:
      enabled: true
  metrics:
    export:
      # OTLP 메트릭 설정
      otlp:
        enabled: true
        url: http://localhost:4318/v1/metrics
        step: 10s
        resource-attributes:
          service.name: product
          service.version: 1.0.0
          deployment.environment: development
      # Prometheus도 함께 활성화 (백업용)
      prometheus:
        enabled: true
    distribution:
      percentiles-histogram:
        http.server.requests: true
        jvm.gc.pause: true
      percentiles:
        http.server.requests: 0.5, 0.95, 0.99
        jvm.gc.pause: 0.5, 0.95, 0.99
    tags:
      application: product
      environment: development
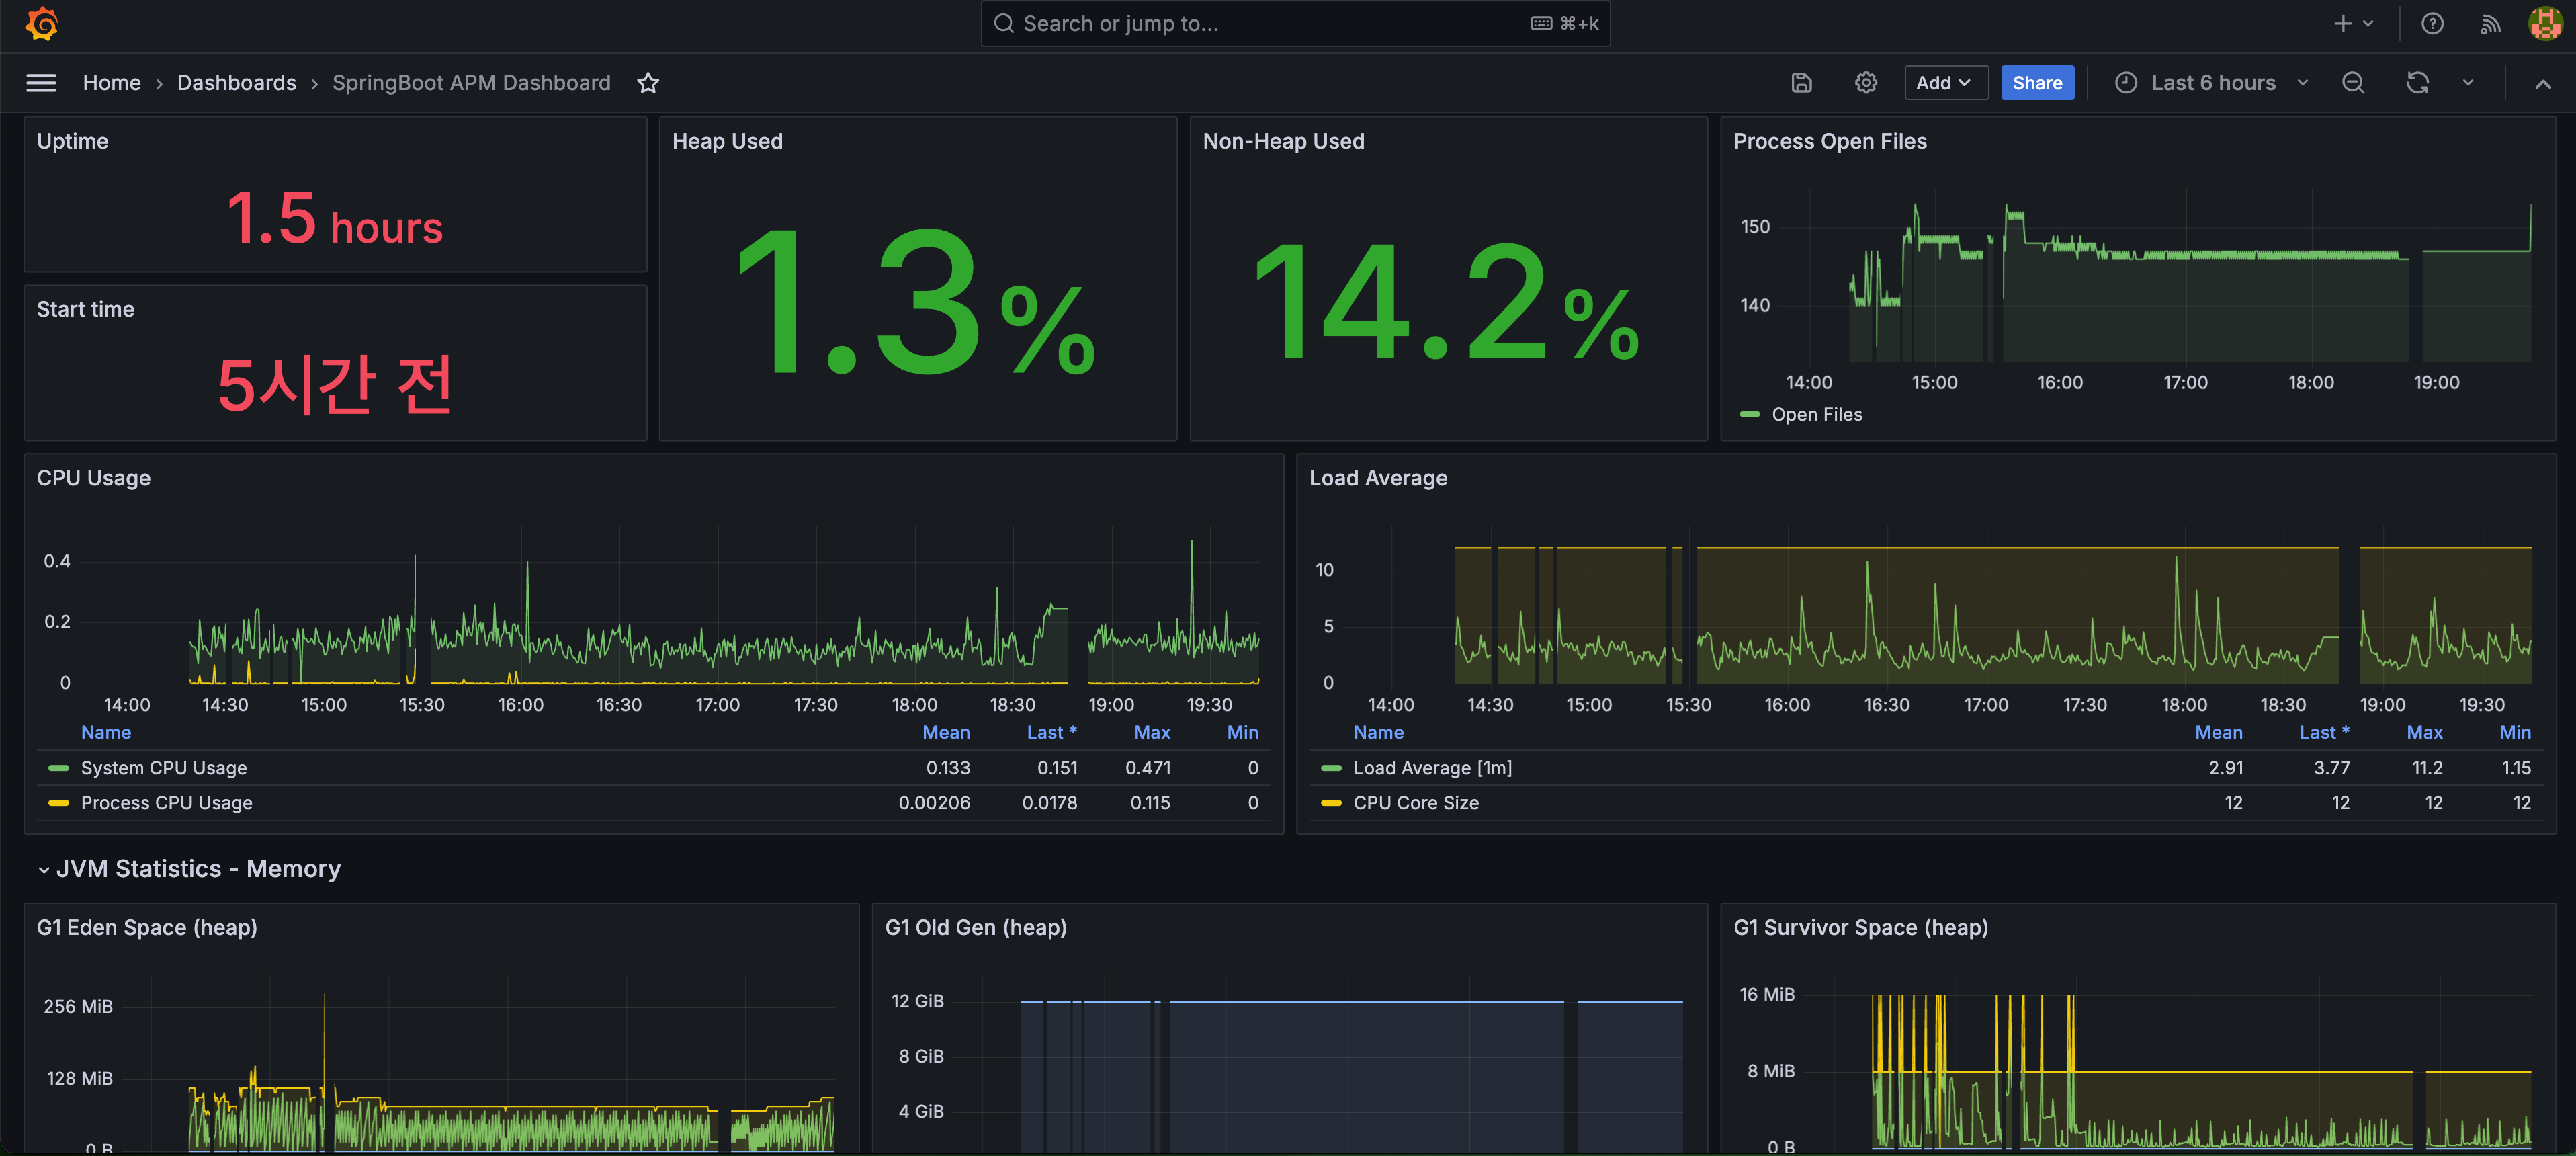
Grafana 결과
프로메테우스는 Grafana Dashboard 사이트에서 Import하였고 Trace와 Log는 Explorer에서 확인 가능함
- Metric(Prometheus)
- Trace(Tempo)
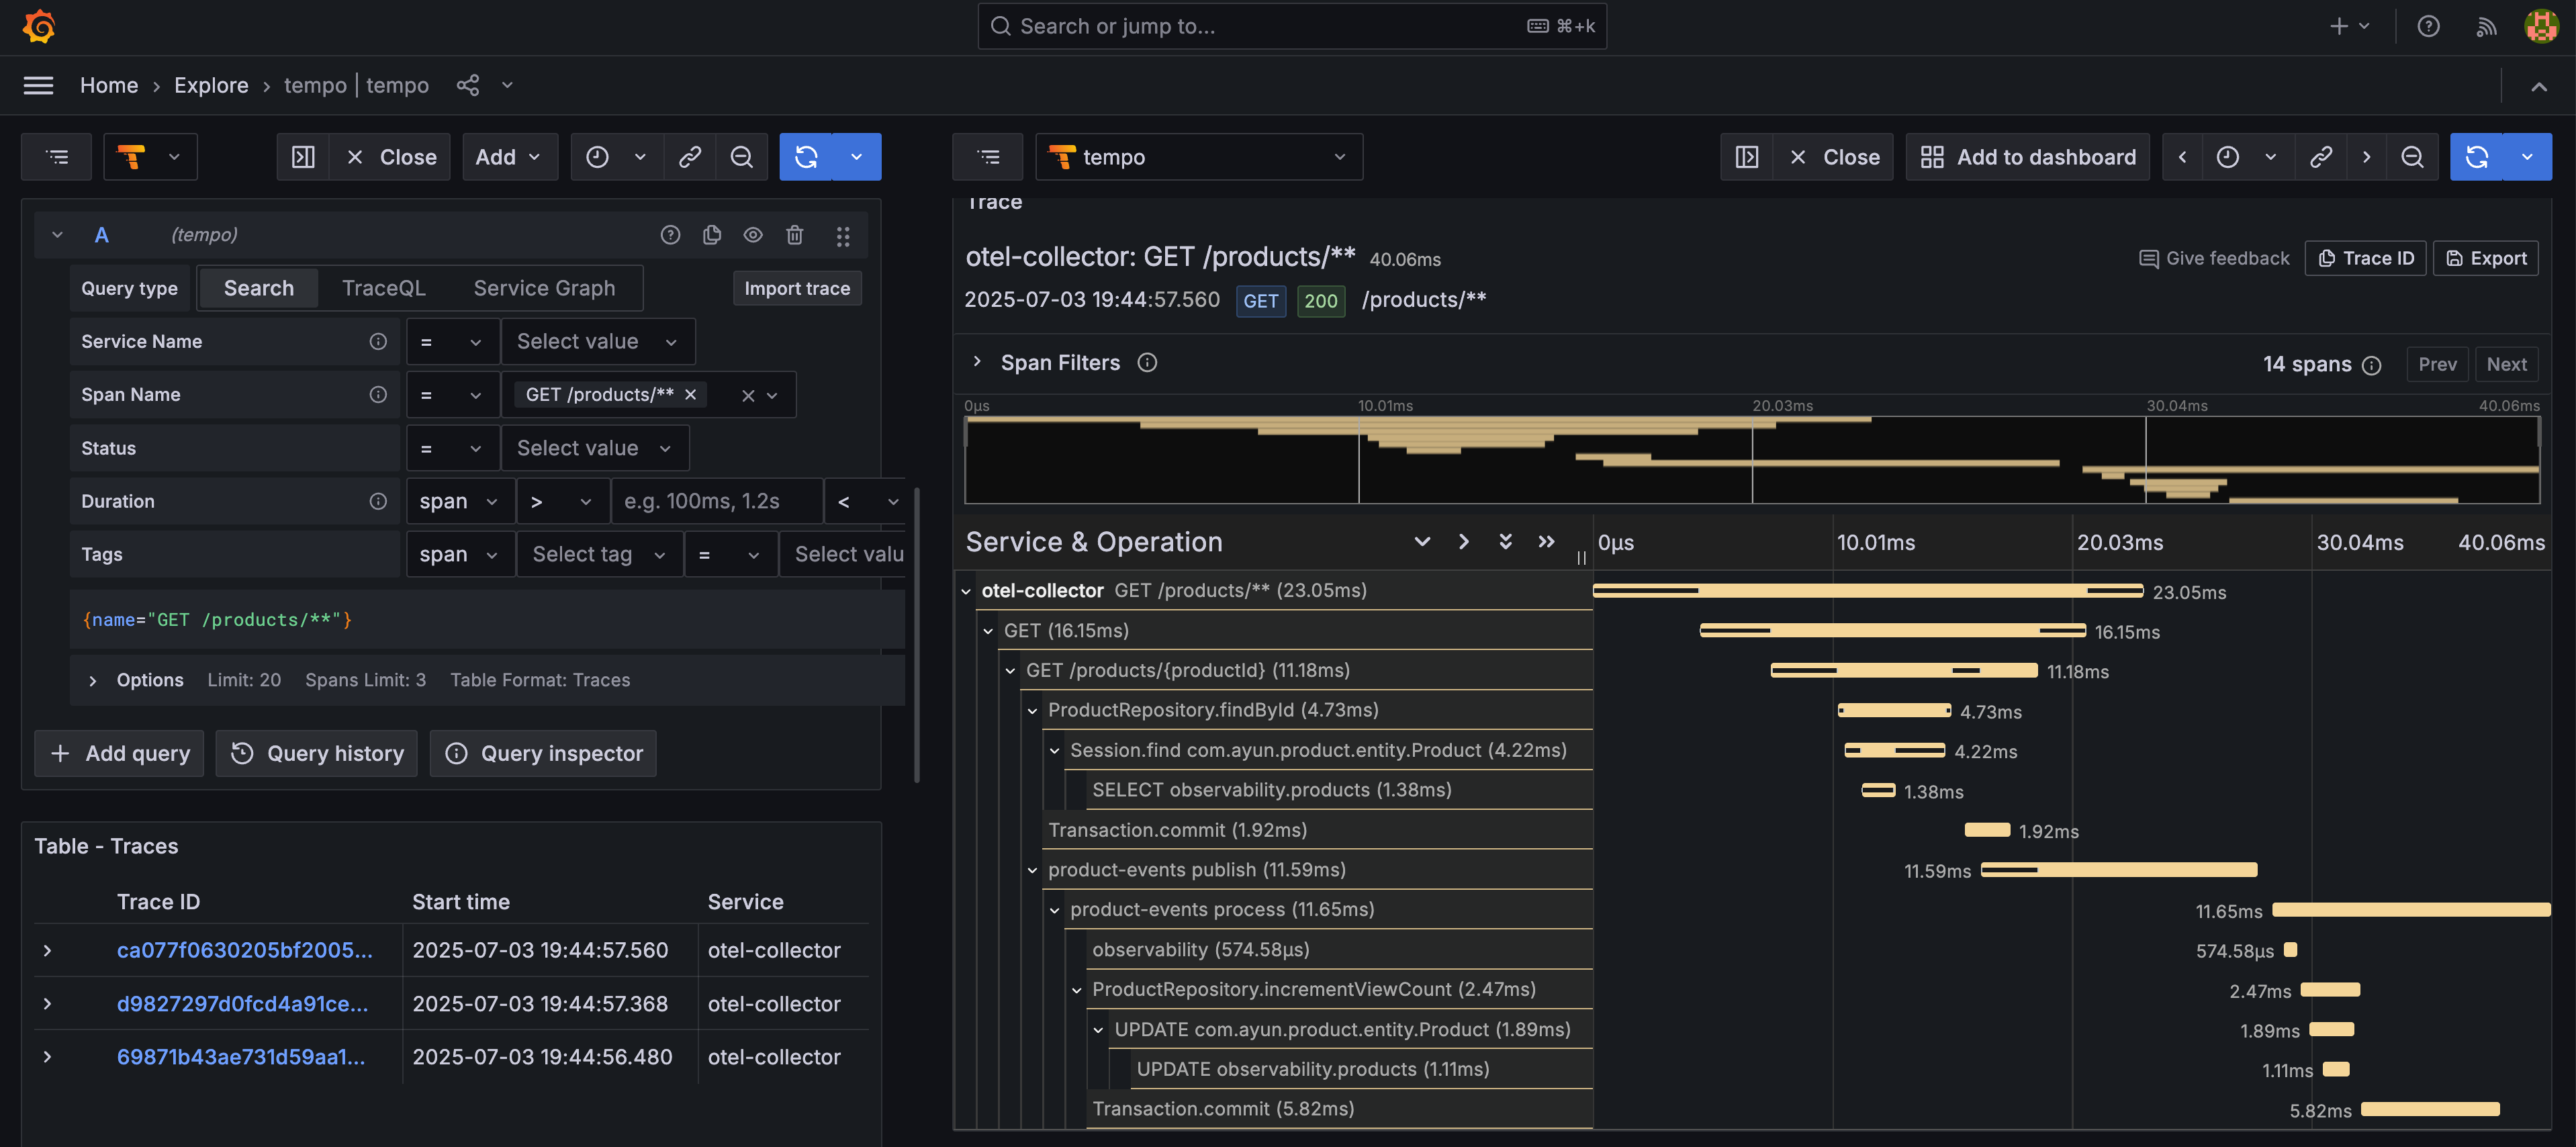 비동기로 실행된 product-events도 span 확인 가능
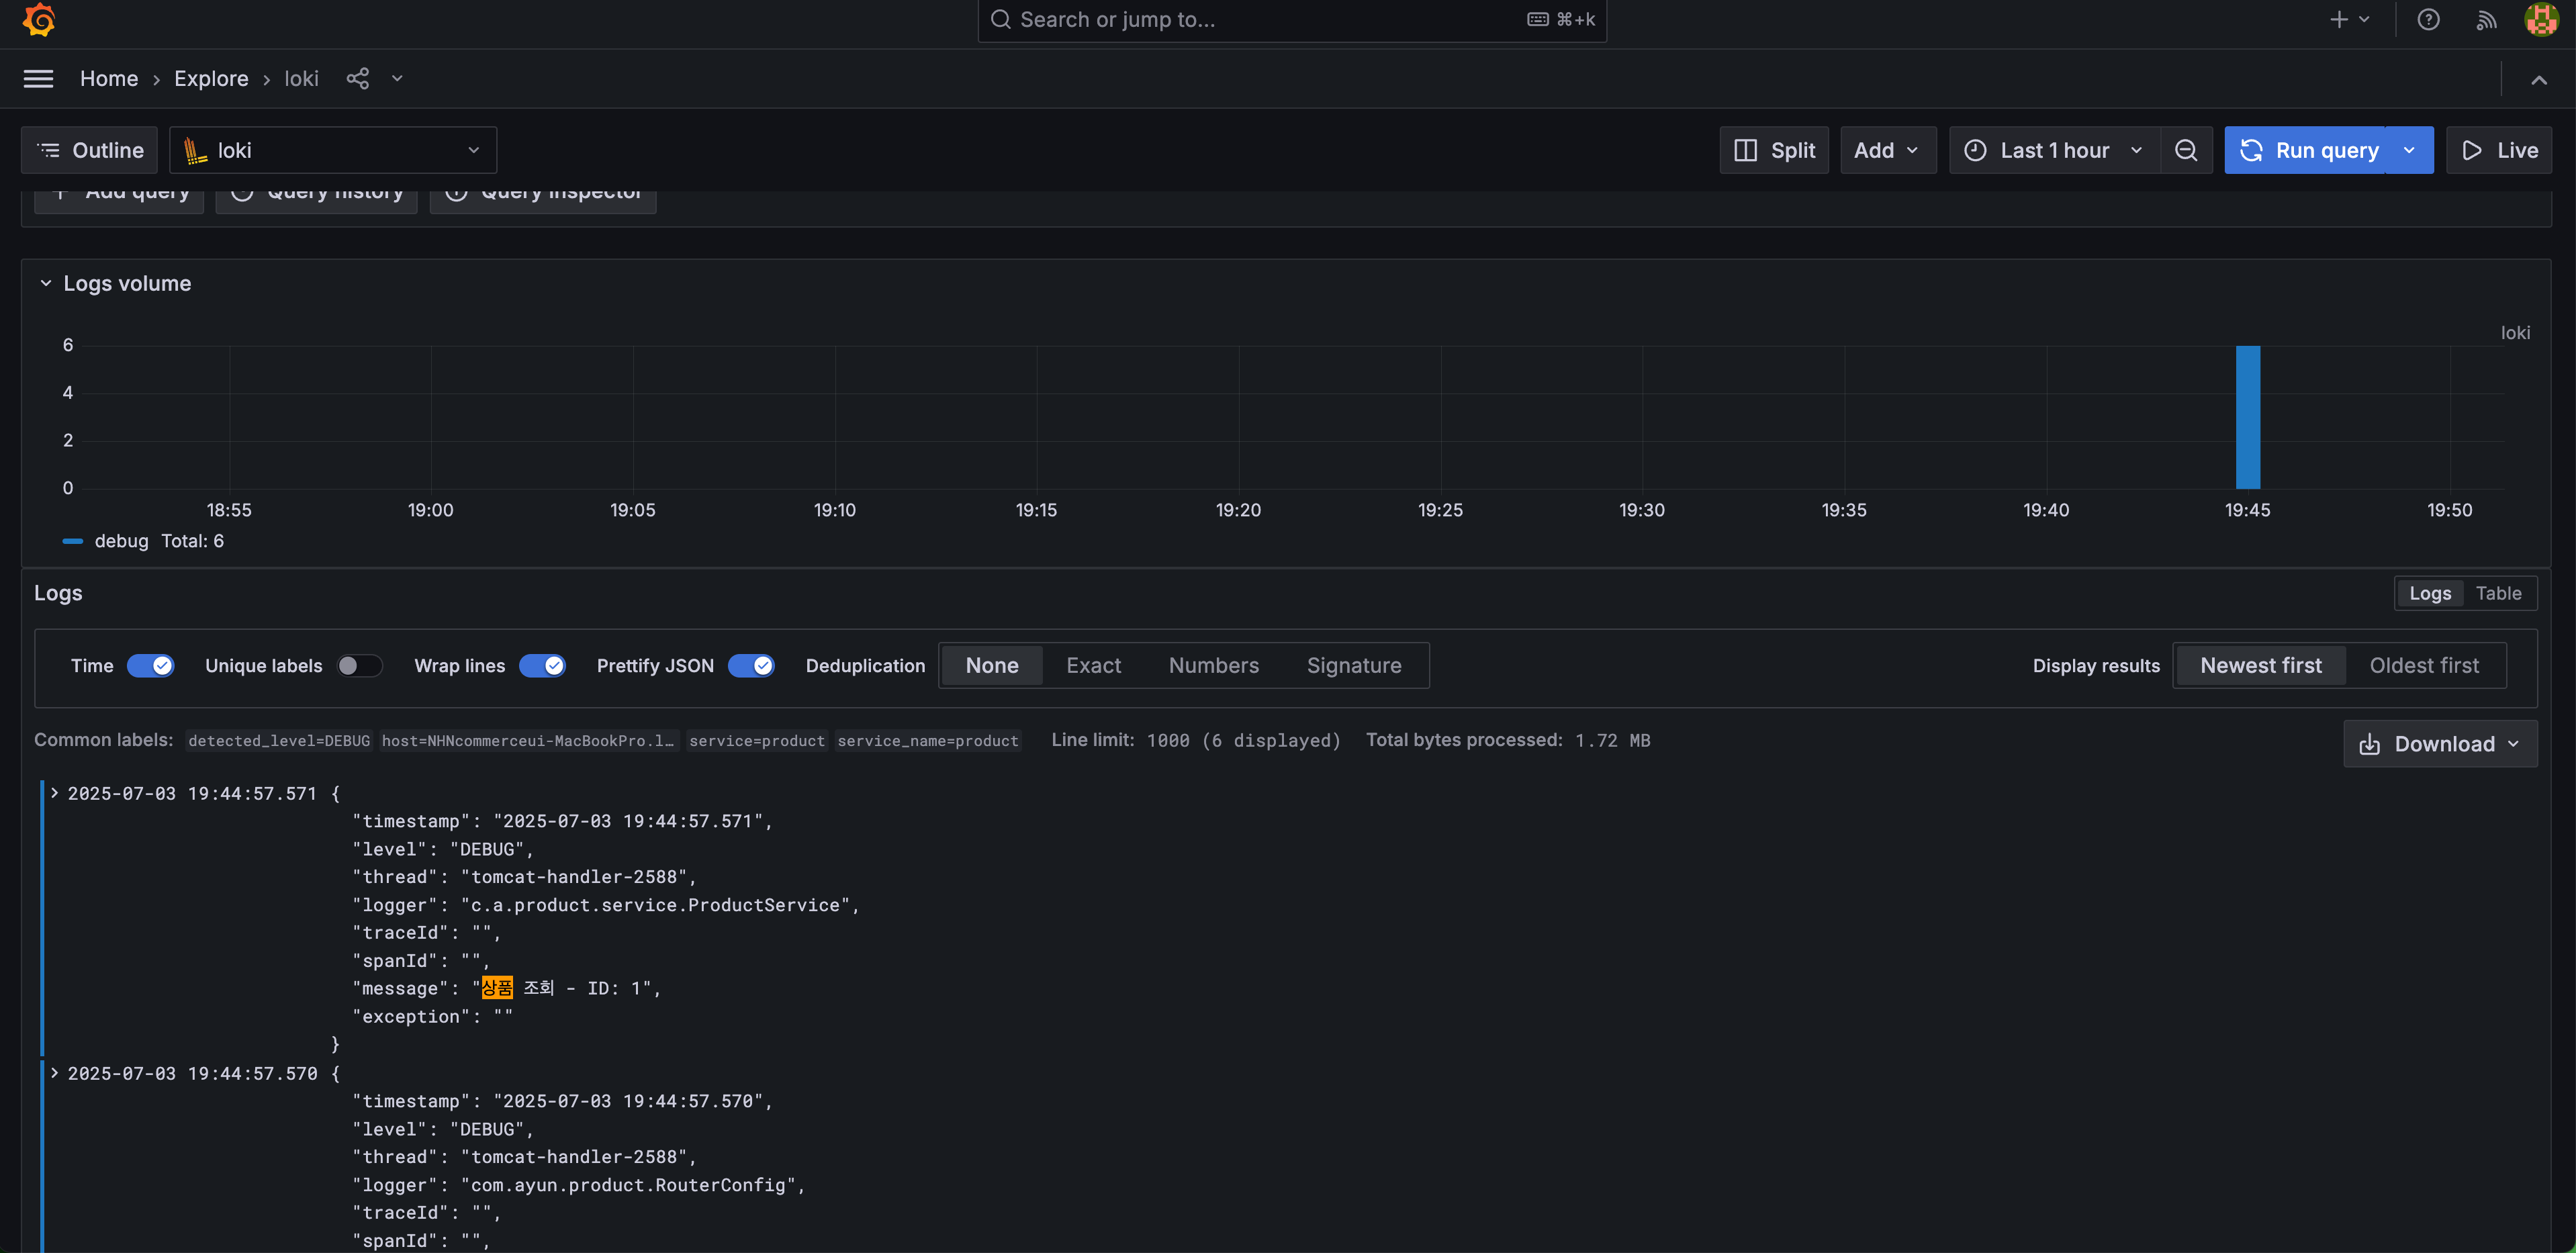
 - Log(Loki)
message 검색 확인
OpenTelemetry VS Pinpoint
| 기능 | Pinpoint | OpenTelemetry |
|---|---|---|
| 시간별 스캐터 차트 | O | O |
| 스캐터 차트에서 드래그를 하면 리스트가 나오는가? | O | 되긴 되는데 시간에 대해서만 슬라이스 가능 |
| 시간별 추적 리스트 | O | O |
| 세부 트랜잭션(스팬) 확인 | O (너무 많이) | O (필요한 것들만!) |
| 알람기능 | O (일부) | O |
| 서비스 그래프 | O | O |
| 추적 로그 커스터마이징 | X | O |
| HTTP Method 확인 가능 | X | O |
| 컨슈머 추적 | X | O |
| UI 커스터마이징 | X | O |
| 언어 제약 | Java/Kotlin, php, python | 거의 없다. |
OpenTelemetry란?
OpeTelemetry는 MSA 환경과 같이 분산 애플리케이션 환경에서 애플리케이션의 로그, 메트릭, 추적데이터를 수집 및 보관하는 오픈소스이다.
OpenTelemetry 자체에서는 애플리케이션 레벨에서의 계측 라이브러리 / 에이전트와 로그, 메트릭, 추적 데이터를 수집하는 collector를 제공하고 있으며, 라이브러리/에이전트와 수집기 사이의 데이터 전달 통신 규칙 (OTLP)을 제공한다.
OpenTelemetry 역할
- Java/Kotlin 뿐 아니라 여러 언어에서 독립적인 계측 라이브러리를 제공 (Javascript, php 등도 지원!)
- 벤더 환경에 독립적으로 배포가 가능하다. (On-premise, Public cloud 등등)
- OTLP(OpenTeLemetry Protocol)을 정의 및 구현
- 계측 라이브러리는 OTLP를 만족하는 log, metric, trace 데이터를 수집하여 백엔드로 저장
- 백엔드는 따로 OpenTelemetry에서 제공하지는 않지만 prometheus, loki, tempo 등의 이미 있는 오픈소스와 연동할 수 있다.
Observability와 OpenTelemetry
Observability는 데이터를 기반으로 시스템에 대한 상태와 내부 동작을 이해하는 능력을 말한다. 시스템에 대한 상태와 내부동작을 이해하려면 그에 걸맞는 데이터가 쌓여있어야 하며, 이러한 데이터는 애플리케이션에서 만들어낸다. 그리고 이러한 데이터를 생성하고 수집하는 것을 계측 이라고 한다.
Observability를 높이려면 애플리케이션이 제대로 계측 되어야 하며, 애플리케이션에서는 Trace, Metric, Log 등과 같은 데이터를 보내야 한다. 이러한 데이터를 수집하면 시스템에 대한 가시성이 생긴다.
OpenTelemetry는 애플리케이션 코드를 계측하여 시스템을 관찰 가능하게 만드는 메커니즘이다.
Architecture & Flow
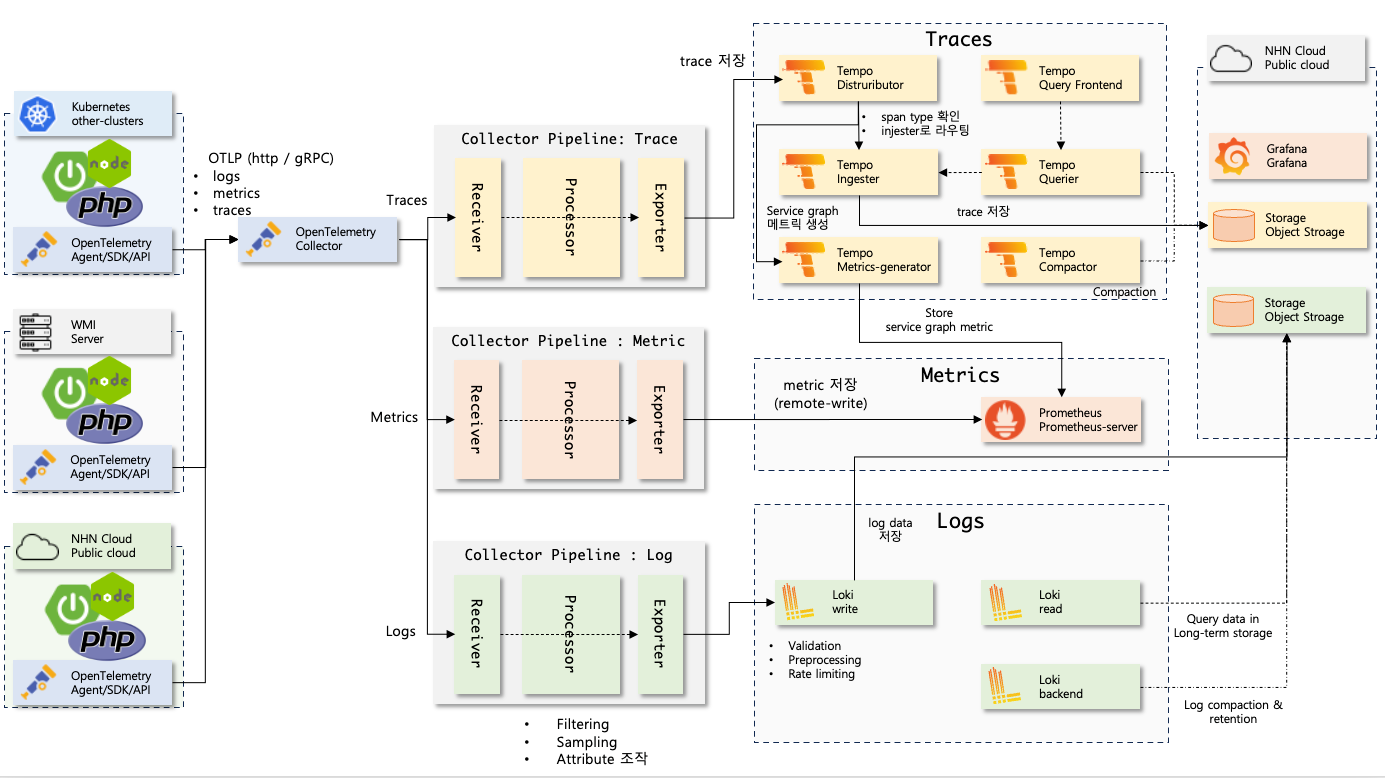
-
애플리케이션 에이전트는 로그, 메트릭, 추적 정보를 만들어서 주기적으로 OpenTelemetry collector에게 보낸다.
- jvm 실행시 agent방식으로 실행하거나
- OpenTelemetry에서 제공하는 SDK를 이용하여 Application에서 전송하거나
- 직접 OpenTelemetry Collector로 전달하거나(http/gRPC)
-
Collector에서는 설정한 파이프라인대로 Log, metric, trace를 수집하고 지정된 Processor를 통해 데이터를 조작한 후 지정된 exporter로 데이터를 보낸다.
- 어플리케이션 로그는 Loki, 추적 데이터는 Tempo, 메트릭을 Prometheus로 보낸다.
# otel-collector-config.yml
service:
  pipelines:
    traces:
      receivers: [otlp]
      processors: [batch, resource]
      exporters: [otlp/tempo]
    metrics:
      receivers: [otlp, prometheus]
      processors: [batch, resource]
      exporters: [prometheus]
    logs:
      receivers: [otlp]
      processors: [batch, resource]
exporters: [loki] -
각 데이터 백엔드 (Loki, Tempo, Prometheus)는 데이터를 보관한다.
-
Grafana dashboard에서 Observability(Log, Trace, Metric)를 시각화한다.
Application Log
Log는 시간 값이 찍힌 텍스트 레코드이다. 보통은 애플리케이션이 특정 시간에 한 작업 내용이나 에러 내용 등 여러가지를 기록하기 위해 로그를 사용한다.
Loki
Log 수집 벡엔드 저장소
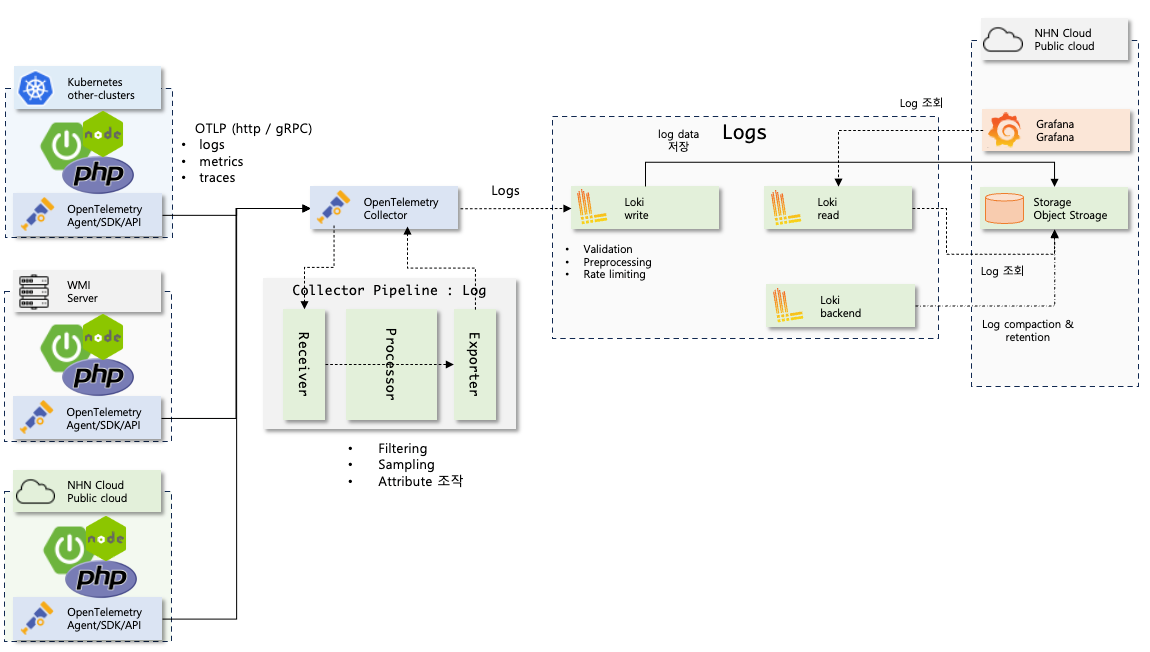
로그 수집 과정은 다음과 같다.
- 애플리케이션 기동시 OpenTelemetry Agent는 LogbackAppender 에 OpenTelemetry collector로 로그를 계측하는 코드 바이너리를 주입한다.
- 애플리케이션에서 로그를 출력하면 LogbackAppender가 반응하여 OpenTelemetry Collector로 로그를 전송한다.
- OpenTelemetry Collector는 정의된 processor를 실행하여 로그 데이터를 조작한 후 정의된 exporter로 로그 데이터를 로그 백엔드로 보낸다. (여기서는 Loki로 보낸다.)
- 로그 백엔드는 로그를 저장한다.
이런 과정을 collector 설정으로 풀면 다음과 같다.
config:
  receivers:
    otlp:
      protocols:
        grpc:
          endpoint: ${env:MY_POD_IP}:4317
        http:
          endpoint: ${env:MY_POD_IP}:4318
  exporters:
    loki:
      endpoint: http://loki-write:3100/loki/api/v1/push
      tls:
        insecure: true
    pipelines:
      logs:
        receivers:
          - otlp
        processors: []
        exporters:
          - loki
      metrics: ...
      traces: ...
config.receivers: 데이터를 받는 리시버를 설정한다. 여기서는 콜렉터 자신을 의미한다.config.exporters: 프로세싱이 끝난 데이터를 보내는 익소포터를 설정한다. 여기서는 Loki로 설정함. OTLP를 지원하는 로그백엔드면 모두 괜찮다.config.popelines.logs: 로그에 대한 파이프라인 설정receivers: 로그 데이터에 대한 리시버를 (데이터 공급자) 지정한다. 여러개 설정 가능하며config.receivers에 선언된 리시버만 설정 가능하다.processors: 데이터 프로세싱이 필요하면 프로세서를 지정한다. 여러개 설정 가능하며config.processors에 선언된 리시버만 설정 가능하다.exporters: 데이터를 저장할 익스포터를 지정한다. 여러개 설정 가능하며config.exporters에 선언된 익스포터만 설정 가능하다.
OTLP Log 구조
에이전트마다 로그 구조가 다를 수 있는데, OpenTelemetry Java agent에서 수집하여 Loki에 저장된 경우 다음과 같은 구조를 따른다.
{
  "body": "HikariPoo1-1 - Failed to validate connection com.mysql.cj.jdbc.ConnectionImp1833fa6894 (Communications link failure\ninThe last packet successfully received from the server was 3, 147 milliseconds ago. The last packet sent suc to the server was 3, 147 milliseconds ago.). Possibly consider using a shorter maxLifetime value.",
  "traceid": "6eb615979ecaa5640a19d6d7896aec78",
  "spanid": "33fc309f3c7fa29a",
  "severity": "WARN",
  "flags": 1,
  "resources": {
    "container.id": "676c44f13510ee20317016779322e@fa65257a25f7515eda5e27690bccc2932c",
    "host.arch": "and64",
    "host.name": "apps-internal-7765f56667-mttbb",
    "os.description": "Linux 5.4.0-177-generic",
    "os.type": "linux",
    "process.command_args": [
      "/opt/java/openjdk/bin/java",
      "-ср",
      "/app/resources:/app/classes:/app/libs/",
      "com.nhncommerce.InternalApplicationkt"
    ],
    "process.executable.path": "/opt/java/openjdk/bin/java",
    "process.pid": 1,
    "process.runtime.description": "Eclipse Adoptium OpenJDK 64-Bit Server VM 21.0.5+11-LTS",
    "process.runtime.name": "OpenJDK Runtime Environment",
    "process.runtime.version": "21.0.5+11-LTS",
    "service.instance.id": "a7444607-78ed-4ee7-9058-88dfc490c4e0",
    "service.name": "apps-internal-alpha",
    "telemetry.distro.name": "opentelemetry-java-instrumentation",
    "telemetry.distroversion": "2.10.0",
    "telemetry.sdk.language": "java",
    "telemetry.sdk.name": "opentelemetry",
    "telemetry.sdk.version": "1.44.1"
  },
  "instrumentation_scope": {
    "name": "com.zaxxer.hikari.pool.PoolBase"
  }
}
필요없는 데이터 제거 - collector processor
로그를 확인할 때 필요없는 메타데이터도 많은데 이런 데이터도 저장하면 용량만 차지하기 때문에 좋지 않다. opentelemetry-collector에서 필요없는 데이터를 제거 할수 있다.
config:
  processors:
    resource:
      attributes:
        - action: delete
          key: container.id
        - action: delete
          pattern: host.*
        - action: delete
          pattern: os.*
        - action: delete
          pattern: process.*
        - action: delete
          pattern: telemetry.*
  service:
    pipelines:
      logs:
        receivers:
          - otlp
        processors:
          - resource
        exporters:
          - loki
- resources 라는 프로세서로 애트리뷰트를 조작할 수 있다.
- 로그 분석용으로 필요없는 데이터를 날린다.
- resources.service 하위를 날리면 안된다.
Debug 로그 스킵
가끔씩 개발자가 로그레벨을 디버그로 하는 경우도 있는데, 디버그 로그는 용량이 커서 저장소에 적재하는 것을 서버 레벨에서 막는 방법을 적어 보았다.
config:
  processors:
    filter/logs:
      logs:
        log_record:
          - "severity_number >= SEVERITY_NUMBER_INFO"
  service:
    pipelines:
      logs:
        receivers:
          - otlp
        processors:
          - filter/logs
          - resource
        exporters:
          - loki
- filter/logs 프로세서에서 INFO 로그 미만의 레벨은 필터링한다.
- 필터링 프로세서는 첫번째로 가는 것이 성능상 이득이다. (순서 중요)
배치 프로세서 추가
배치 프로세서는 trace, metric, log를 받아서 배치단위로 만든다. 배치는 데이터를 압축하고 데이터를 전송하는 데 필요한 요청 수를 줄이는 데 도움이 된다. (필수)
config:
  processors:
    batch:
      send_batch_size: 8192
      timeout: 200ms
      send_batch_max_size: 0
  service:
    pipelines:
      logs:
        receivers:
          - otlp
        processors:
          - filter/logs
          - resource
          - batch
        exporters:
          - loki
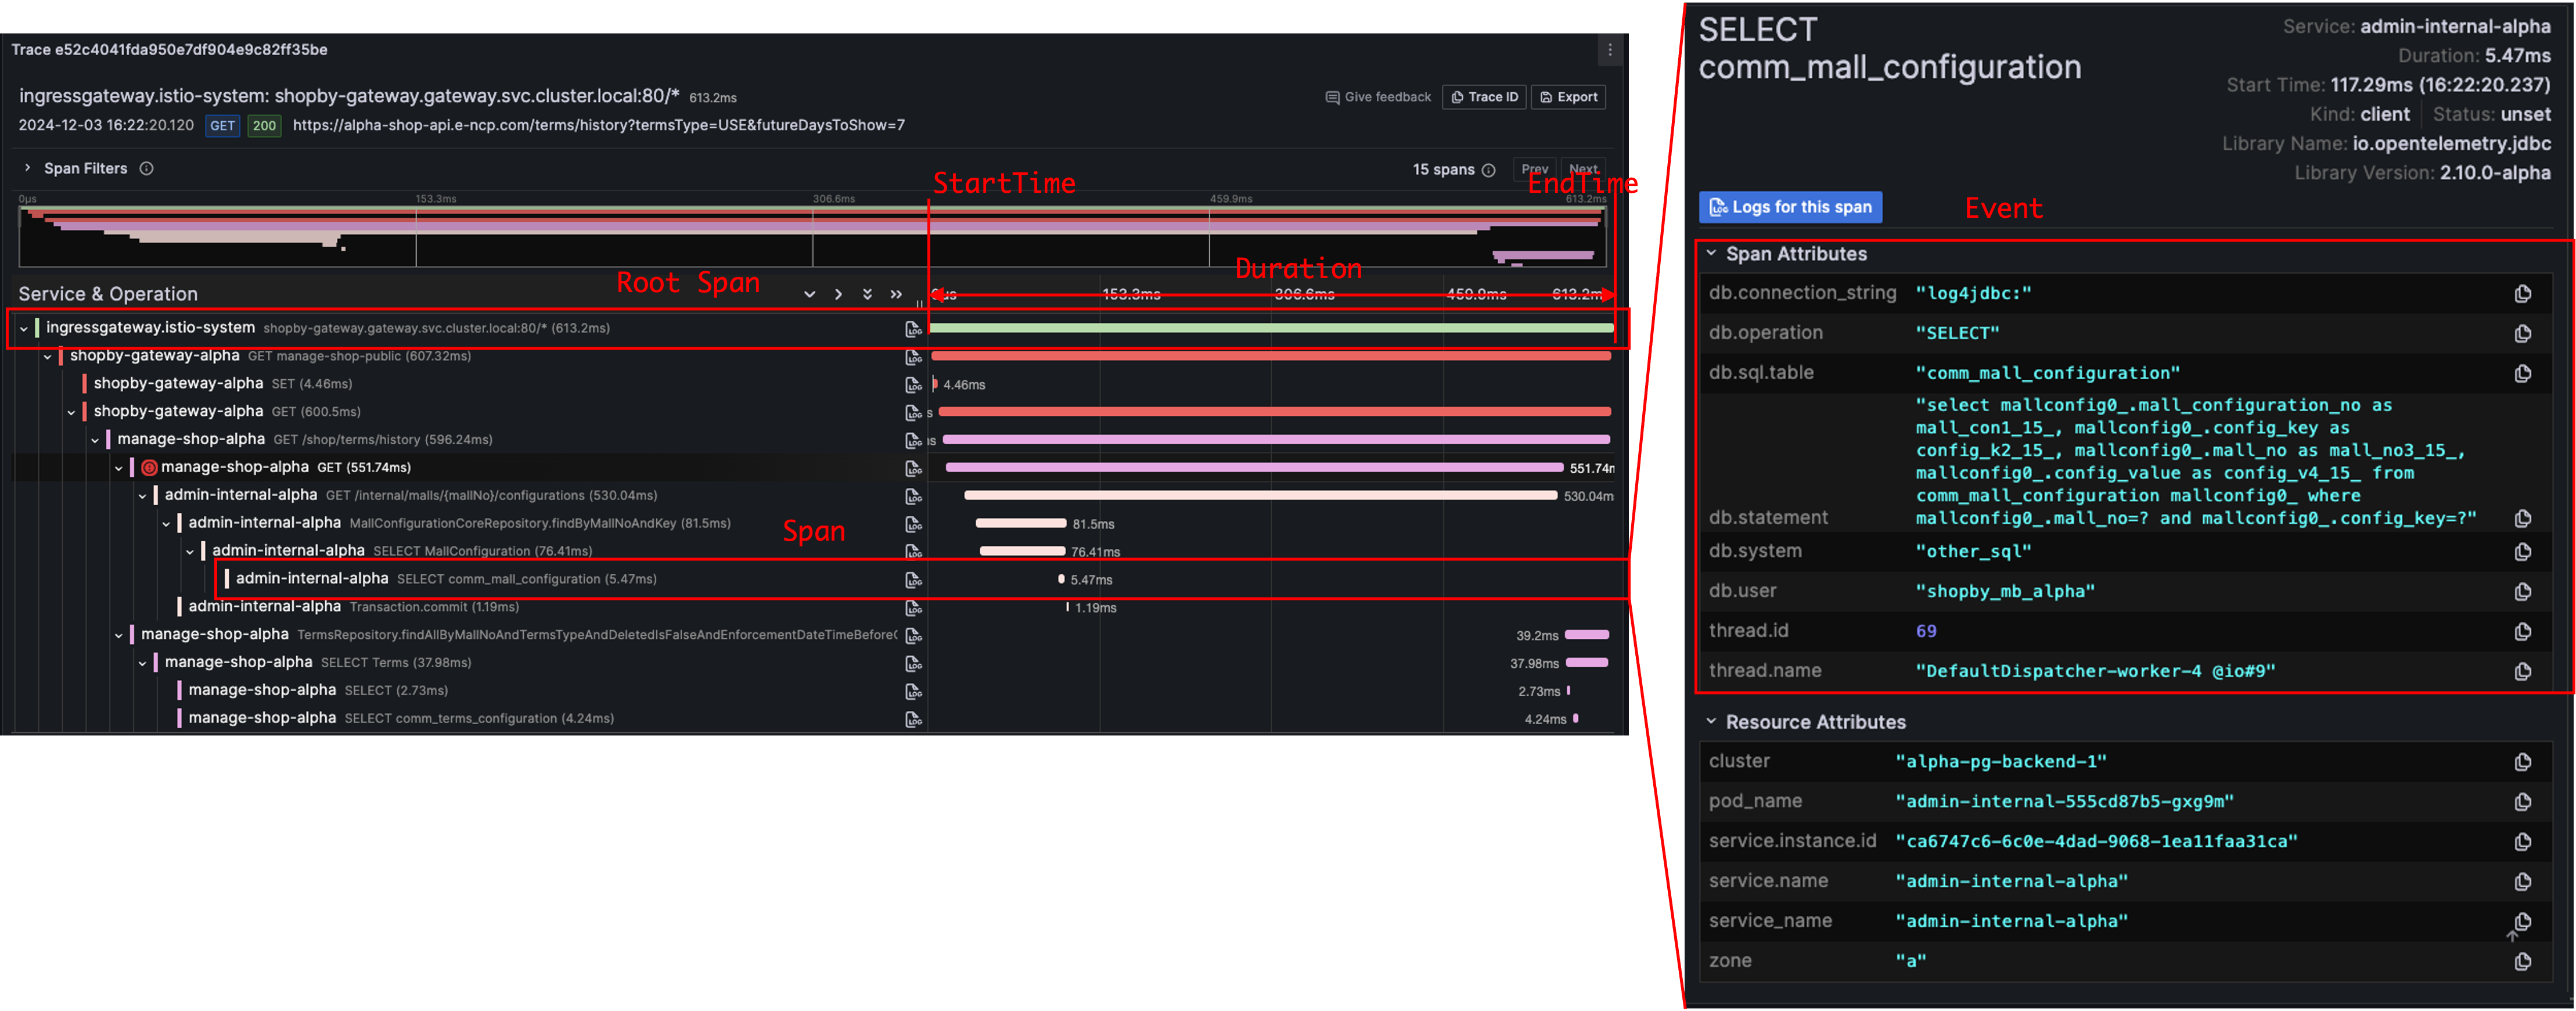
Trace
Trace는 애플리케이션에서 요청이 일어났을 때 어떤 일이 발생하는지에 대한 전반적인 그림을 보여준다. Traces는 여러개의 Span을 가지며 하나의 span에서는 하나의 작업에 대한 정보를 담고있으며, 같은 Trace의 span은 traceId를 공유한다.
Span 구조
{
  "name": "hello-greetings",
  "context": {
    "trace_id": "5b8aa5a2d2c872e8321cf37308d69df2",
    "span_id": "5fb397be34d26b51"
  },
  "parent_id": "051581bf3cb55c13",
  "start_time": "2023-04-29T18:52:58.114304Z",
  "end_time": "2023-04-29T22:52:58.114561Z",
  "attributes": {
    "http.route": "some_route2"
  },
  "events": [
    {
      "name": "hey there!",
      "timestamp": "2023-04-29T18:52:58.114561Z",
      "attributes": {
        "event_attributes": 1
      }
    },
    {
      "name": "bye now!",
      "timestamp": "2023-04-29T18:52:58.114585Z",
      "attributes": {
        "event_attributes": 1
      }
    }
  ]
}
- 하나의 Trace는 고유의 traceId를 가진다.
- 한 trace의 각 span에는 고유의 spanId를 가지며, traceId를 공유한다.
- 각 span에는 parentId를 가지며, 이 값은 부모의 spanId이다.
- parentId가 null인 span을 root span이라고 한다.
- 각 span에는 start_time, end_time을 가지며 span 처리시작/종료 시간이다.
- event에는 span에서 있었던 이벤트에 대한 내용이 담겨있다. 이 정보를 바탕으로 트랜잭션에서 있었던 일을 짐작할 수 있다.
Propagation
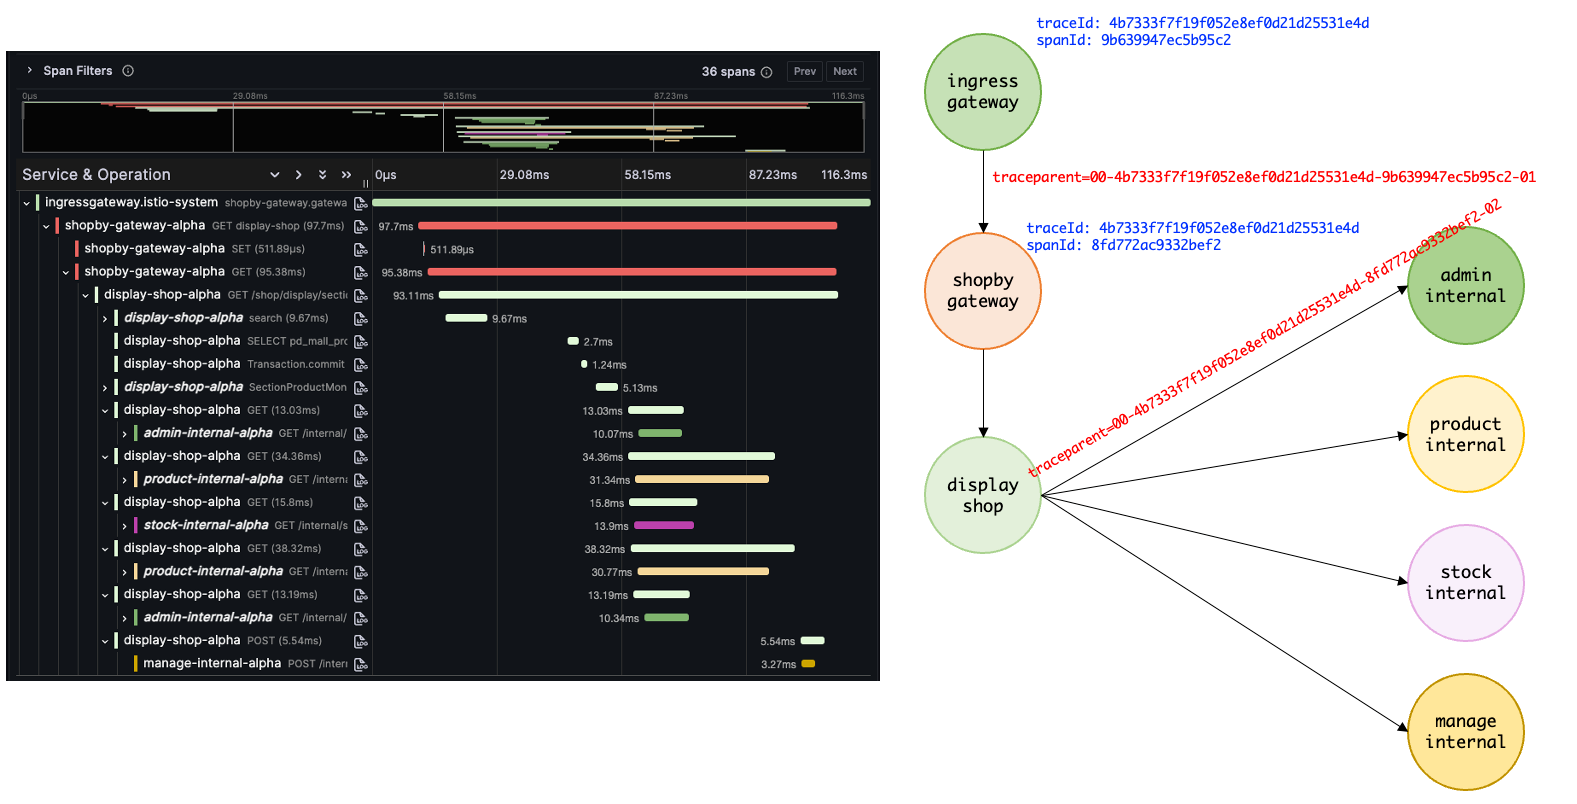
애플리케이션은 각각 독립적으로 구동이 되는데 각 Span은 어떻게 traceId를 공유할 수 있을까? 자동 계측의 경우 OpenTelemetry agent에서 traceId를 공유하는 방식을 포함하여 코드 바이너리를 주입한다.
한 트랜잭션에서 애플리케이션 사이의 통신이 이루어지면 통신을 할 때 traceId를 전달하는데, 이 과정을 Propagation이라고 한다. Propagation의 방식은 여러가지가 있으며, 기본적으로는 tracecontext와 baggage 방식을 사용한다.
tracecontext
tracecontext 방식은 traceparent 헤더와 trancestate 헤더를 전달하는 방식으로 propagation을 진행한다.
traceparent헤더는 트랜잭션에서의 traceId를 전달하는 헤더이다. 해당 헤더는 다음과 같은 구조를 가진다 (00-0af7651916cd43dd8448eb211c80319c-b7ad6b7169203331-01)-를 기준으로 의미가 나뉜다.- 첫 번째 값은 버전이다. (
00) - 두 번째 값은 traceId이다. (
0af7651916cd43dd8448eb211c80319c, 16 byte) - 세 번째 값은 parent spanId이다. (
b7ad6b7169203331, 8 byte) - 네 번째 값은 flag이다. (
01, 2 byte)
tracestate헤더는 벤더별 형식으로 parent spanId를 포함한다. (congo=t61rcWkgMzE)
Root Span - istio ingressgateway
Root span은 트랜잭션이 시작하는 순간 기록된다. 우리의 경우에는 Istio ingressgateway에서 가장 먼저 트래픽을 받기 때문에 ingressgateway에서 root span을 만들어야 한다.
그렇다면 ingressgateway에서도 OTLP로 Trace 정보를 opentelemetry collector에게 보내줘야하고, ingressgateway에서 traceId를 만들어내야 한다. 이렇게 하려면 설정이 필요하다.
istiod meshConfig 설정
defaults:
  meshConfig:
    enableTracing: true
    extensionProviders:
    - name: opentelemetry
      opentelemetry:
        port: {{ OPENTELEMETRY_COLLECTOR_PORT }}
        service: {{ OPENTELEMETRY_COLLECTOR_ADDRESS }}
        http:
          path: "/v1/traces"
          timeout: 5s
          headers: []
        resource_detectors:
          environment: {}
- opentelemetry extensionProviders 설정이 필요하다.
Telemetry 설정
apiVersion: telemetry.istio.io/v1
kind: Telemetry
metadata:
  name: ingressgateway
  namespace: istio-system
spec:
  selector:
    matchLabels:
      istio: ingressgateway
  # no selector specified, applies to all workloads
  tracing:
  - providers:
      - name: opentelemetry
    randomSamplingPercentage: 100
- 추가로 telemetry 설정도 필요하다.
spec.selector.matchLabels에서 레이블 셀렉터로 ingressgateway에만 적용하도록 구성한다. 없으면 사이드카까지 모두 구성될 수 있다.
현재는 각 클러스터 내 collector 네임스페이스의 opentelemetry-collector와 통신하지만, 만약 collector가 클러스터 외부에 있다면 DestinationRule, ServiceEntry를 추가해야 한다.
apiVersion: networking.istio.io/v1alpha3
kind: ServiceEntry
metadata:
  name: opentelemetry
spec:
  hosts:
  - otel-collector.nhn-commerce.com
  ports:
  - number: 80
    name: http-port
    protocol: HTTP
  resolution: DNS
  location: MESH_EXTERNAL
---
apiVersion: networking.istio.io/v1alpha3
kind: DestinationRule
metadata:
  name: opentelemetry
spec:
  host: otel-collector.nhn-commerce.com
  trafficPolicy:
    portLevelSettings:
    - port:
        number: 80
      loadBalancer:
        simple: ROUND_ROBIN
Trace 수집 - Tempo
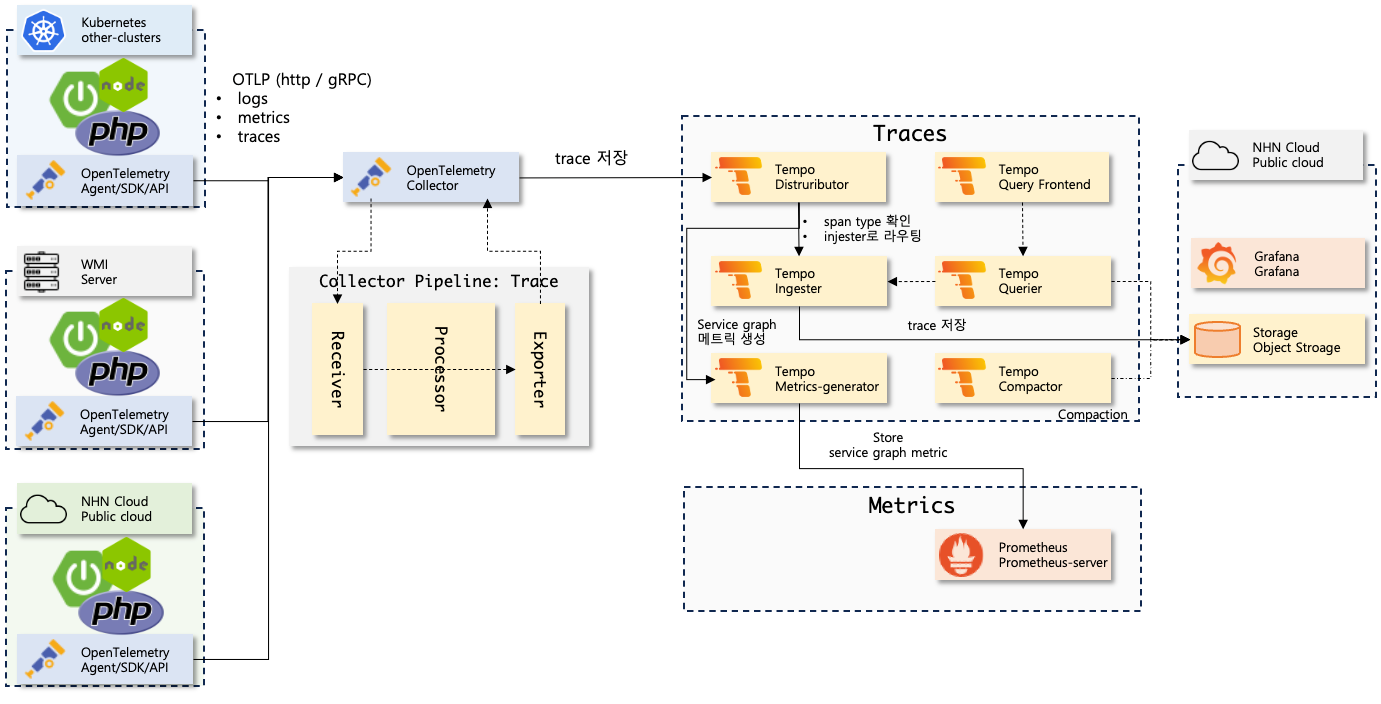
Trace 수집 과정은 다음과 같다.
- 애플리케이션 기동시 OpenTelemetry Agent는 여러 라이브러리에 OpenTelemetry collector로 Span을 계측하는 코드 바이너리를 주입한다.
- 애플리케이션에서 Span을 생성하면 OpenTelemetry Collector로 Span을 전송한다.
- collector는 정의된 processor를 실행하여 추적 데이터를 조작(필터링) 후 정의된 exporter로 추적 데이터를 추적 백엔드로 보낸다. (Tempo)
- 추적 백엔드는 추적데이터를 (span) 저장한다.
- Tempo에서는 distributor가 injester와 metric-generator로 데이터를 보낸다.
- injester는 추적데이터를 저장한다.
- metric-generator는 주기적으로 추적데이터를 모아서 통계낸 후 메트릭으로 만들어낸다.
이런 과정을 collector 설정으로 풀면 다음과 같다.
config:
  receivers:
    otlp:
      protocols:
        grpc:
          endpoint: ${env:MY_POD_IP}:4317
        http:
          endpoint: ${env:MY_POD_IP}:4318
  exporters:
    tempo:
      endpoint: tempo-distributor-discovery:4317
      tls:
        insecure: true
  service:
    pipelines:
      traces:
        receivers:
          - otlp
        processors: []
        exporters:
          - tempo
      metrics: ...
      logs: ...
config.receivers: 데이터를 받는 리시버를 설정한다. 여기서는 콜렉터 자신을 의미한다.config.exporters: 프로세싱이 끝난 데이터를 보내는 익스포터를 설정한다. 여기서는 Tempo로 설정함. OTLP를 지원하는 추적 백엔드면 모두 괜찮다.config.popelines.traces: trace에 대한 파이프라인 설정receivers: 추적 데이터에 대한 리시버를 (데이터 공급자) 지정한다. 여러개 설정 가능하며config.receivers에 선언된 리시버만 설정 가능하다.processors: 데이터 프로세싱이 필요하면 프로세서를 지정한다. 여러개 설정 가능하며config.processors에 선언된 리시버만 설정 가능하다.exporters: 데이터를 저장할 익스포터를 지정한다. 여러개 설정 가능하며config.exporters에 선언된 익스포터만 설정 가능하다.
필터링 및 샘플링
헬스체크와 같이 추적을 하지 않아도 되는 요청은 거르고, 데이터 보관 및 쿼리를 용이하게 하기 위해 리얼환경 정상인 요청들은 1%으로 샘플링하여 추적 데이터를 보관한다.
config:
  processors:
    tail_sampling:
      policies:
        - name: drop_redis_health_checks
          type: string_attribute
          string_attribute:
            enabled_regex_matching: true
            invert_match: true
            key: db.statement
            values:
              - \/PSUBSCRIBE.*
              - \/HELLO.*

        - name: drop_noisy_traces_target
          string_attribute:
            enabled_regex_matching: true
            invert_match: true
            key: url.path
            values:
              - \/metrics
              - .*actuator.*
              - opentelemetry\.proto
              - favicon\.ico
              - .*health.*
              - .*healthCheck.*
          type: string_attribute

        - name: drop_user_agent
          type: string_attribute
          string_attribute:
            enabled_regex_matching: true
            invert_match: true
            key: user_agent
            values:
              - \/Blackbox.*

        - name: drop_options_method
          string_attribute:
            enabled_regex_matching: true
            invert_match: true
            key: http.method
            values:
              - OPTIONS
          type: string_attribute

        - name: select_error_request
          status_code:
            status_codes:
              - ERROR
          type: status_code

        - name: select_alpha
          string_attribute:
            enabled_regex_matching: true
            key: service.name
            values:
              - \.*-alpha$
          type: string_attribute
        - latency:
            threshold_ms: 500
          name: select_slow_request
          type: latency
        - name: sample_one_percent
          probabilistic:
            sampling_percentage: 1
          type: probabilistic

  service:
    pipelines:
      traces:
        receivers:
          - otlp
        processors:
          - tail_sampling
          - resource
        exporters:
          - tempo
*drop_redis_health_checks: Redis 헬스체크 요청에 대한 추적 제거
drop_noisy_traces_target: HTTP 헬스체크 요청 및 메트릭 수집에 대한 추적 제거drop_user_agent: blackbox exporter의 요청에 대한 추적 제거drop_options_method: HTTP OPTION 메서드에 대한 추적 제거select_error_request: Error 요청에 대한 추적은 100% 수집select_alpha: 알파 환경에 대한 추적은 100% 수집select_slow_request: latency가 500ms 이상인 요청은 100% 수집sample_one_percent: 위의 요청 외의 모든 요청은 1%만 수집 (리얼 정상 요청)
Metric
Metric은 CPU 사용량이나 메모리 사용량과 같이 특정 시점에서의 상태를 기록하는 데이터이다.
Prometheus
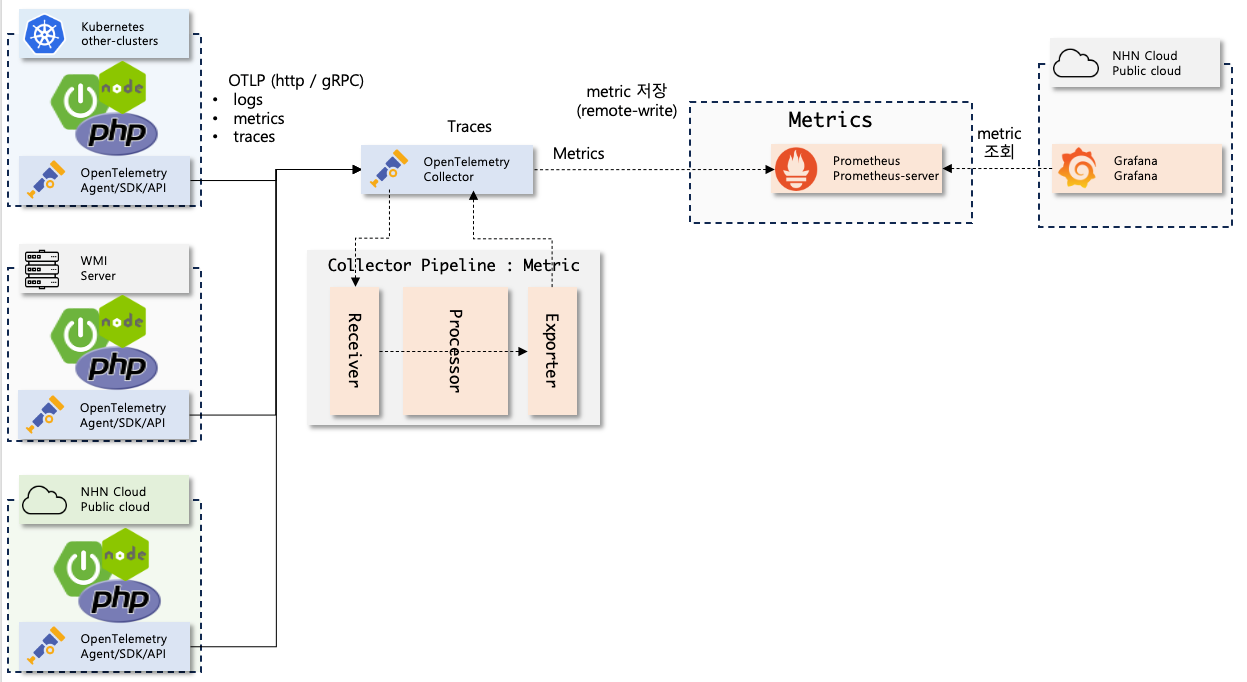
메트릭 수집 과정은 다음과 같다.
-
애플리케이션이 뜰 때 OpenTelemetry Agent는 여러 라이브러리에 OpenTelemetry collector로 메트릭을 계측하는 코드 바이너리를 주입한다.
-
애플리케이션은 주기적으로 메트릭을 OpenTelemetry Collector로 전달한다.
-
collector는 정의된 Processor를 실행하여 메트릭 데이터를 조작한 후 정의된 exporter로 메트릭 데이터를 메트릭 백엔드로 보낸다. (여기서는 Prometheus로 보낸다.)
-
메트릭 백엔드는 메트릭을저장한다.
이런 과정을 collector 설정으로 풀면 다음과 같다.
config:
  receivers:
    otlp:
      protocols:
        grpc:
          endpoint: ${env:MY_POD_IP}:4317
        http:
          endpoint: ${env:MY_POD_IP}:4318
  exporters:
    prometheusremotewrite:
      endpoint: http://prometheus-server.collector.svc.cluster.local/api/v1/write
  service:
    pipelines:
      metrics:
        receivers:
          - otlp
        processors: []
        exporters:
          - prometheusremotewrite
어떤 메트릭을 수집할까?
OpenTelemetry agent가 수집하는 logs, traces, metrics은 애플리케이션에서 사용 중인 라이브러리에 따라 다를 수 있으며, 자세한 것은 다음 문서에서 확인할 수 있다.
 만약 WebFlux를 사용하고 있는 애플리케이션이 있다면 에이전트 연동 시 HTTP client / server 와 관련된 Span, metric을 수집하며 메트릭의 종류는 다음과 같다. (HTTP Server Metrics 링크 참조)
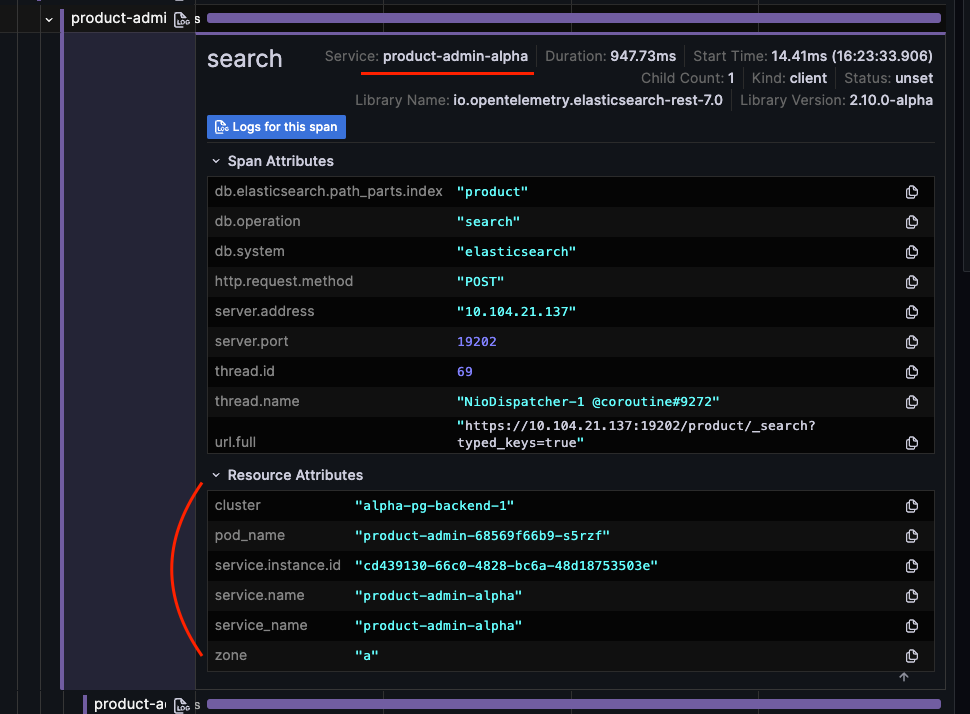
Processing
아무런 조작없이 OpenTelemetry agent -> collector -> prometheus로 쌓인 메트릭을 확인해보면 job, instance 어트리뷰트만 조회 가능하다.

적절한 어트리뷰트를 추가해줘야 메트릭을 잘 활용할 수 있을 것이다.
수집된 메트릭
transform processor
transform processor를 활용하면 메트릭에 어트리뷰트를 추가할 수 있다.
config:
  processors:
    transform/metrics:
      error_mode: ignore
      metric_statements:
        - context: datapoint
          statements:
            - set(attributes["pod_name"], resource.attributes["pod_name"])
            - set(attributes["cluster"], resource.attributes["cluster"])
            - set(attributes["zone"], resource.attributes["zone"])
            - set(attributes["service_name"], resource.attributes["service_name"])
  service:
    pipelines:
      metrics:
        receivers:
          - otlp
        processors:
          - resource
          - transform/metrics
        exporters:
          - prometheusremotewrite
- resources.attributes는 OTLP 데이터의 필드이며, 이 값은 log, metric, trace 모두 같은 값으로 할당되어있기 때문에 trace를 통해 확인하자.
적용 계획
Log, Metric, Trace정보를 잘 활용하여 가시성을 높이기 위해서 각 데이터에 공통 속성을 추가하는 것이 좋다.
공통 속성을 추가하는 방식은 여러가지가 있겠지만 크게는 Agent와 Collector에서 추가하는 방식이 있다.
K8S 공통 변수 (예정)
| 변수 이름 | 설명 | 설정 위치 |
|---|---|---|
| service_name | 앱 이름 | Agent (Chart) |
| pod_name | 파드 이름 | Agent (Chart) |
| node_name | 인스턴스 이름 | Agent (Chart) |
| part | 파트 | Agent (Chart) |
| platform (shopby | commerce | godomall) | 플랫폼 | Agent (Chart) |
| project | 프로젝트 | Agent (Chart) |
| namespace | 네임스페이스 | Agent (Chart) |
| cluster | 클러스터 이름 | Collector |
OpenTelemetry Agent 설정
애플리케이션을 띄울 때 OpenTelemetry agent를 활성화하는데, 이 때 옵션/환경변수로 속성을 추가할 수 있다.
vm option 설정
-javaagent:/otel-agent/opentelemetry-javaagent.jar
-Dotel.exporter.otlp.endpoint=http://otel-collector.nhn-commerce.com
-Dotel.service.name={{ $release.Name }}-{{ $values.app.profile | trimPrefix "k8s-" }}
-Dotel.exporter.otlp.protocol=http/protobuf
-Dotel.resource.attributes=pod_name=$(POD_NAME),node_name=$(NODE_NAME),service_name={{ $release.Name }}-{{ $values.app.profile | trimPrefix "k8s-" }},part={{ $Values.part }},project={{ $Values.project }},namespace=$(NAMESPACE),platform={{ .Values.platform }}
-Dotel.metric.export.interval=10000
환경변수
옵션에서 문자는 대문자로, .은 _로 변경하면 환경변수로 설정 가능하다.
OTEL_EXPORTER_OTLP_ENDPOINT: opentelemetry.collector
OTEL_SERVICE_NAME: {{ $release.Name }}-{{ $values.app.profile | trimPrefix "k8s-" }}
OTEL_EXPORTER_OTLP_PROTOCOL: http/protobuf
OTEL_RESOURCE_ATTRIBUTES: pod_name=$(POD_NAME),node_name=$(NODE_NAME),service_name={{ $release.Name }}-{{ $values.app.profile | trimPrefix "k8s-" }},part={{ $Values.part }},project={{ $Values.project }},namespace=$(NAMESPACE),platform={{ .Values.platform }}
OTEL_METRIC_EXPORT_INTERVAL: "10000"
OTEL_EXPORTER_OTLP_ENDPOINT: 오픈텔레메트리 콜렉터 주소, 각 쿠버네티스 클러스터에 collector 네임스페이스에 오픈텔레메트리 콜렉터 배포 예정OTEL_SERVICE_NAME: 필수값이며 서비스의 이름을 나타낸다. OTEL에서 서비스는 애플리케이션 고유 이름으로 보면 되고,애플리케이션 이름 - 스테이지로 표기할 예정OTEL_EXPORTER_OTLP_PROTOCOL: OTLP 프로토콜 지정, HTTP 방식과 GRPC 방식이 있다.OTEL_RESOURCE_ATTRIBUTES: 추가 애트리뷰트를 설정할 수 있다, key=value로 설정하며,구분자로 여러 개 등록 가능하다.OTEL_METRIC_EXPORT_INTERVAL: 메트릭 전송 주기이며 ms 단위이다. 기본 1분이므로 지정하는 것이 좋음.
OpenTelemetry collector
collector에서도 공통 어트리뷰트를 지정할 수 있다.
config:
  processors:
    resource:
      attributes:
      - action: insert
        key: cluster
        value: alpha-pg-backend-1
    k8sattributes:
      auth_type: "serviceAccount"
      passthrough: false
      filter:
        # only retrieve pods running on the same node as the collector
        node_from_env_var: NODE_NAME
      extract:
        labels:
        - tag_name: zone
          key: topology.kubernetes.io/zone
          from: node
- 클러스터 이름
- 가용성존 이름
세부 정책
Log
- INFO 이상의 로그만 수집? (ERROR/WARN만 수집?)
- 로그 적재 기간은 2주
Trace
- 헬스체크와 관련이 있는 요청은 제외
- 알파기준 모두 수집
- 리얼 기준 에러 발생의 경우 모두 수집 (4XX, 5XX에 따라 달라져야하는지는 고민)
- latency가 500ms 이상인 경우는 모두 수집 (기준은 달라질 수 있음, low latency 기준을 정해야함)
- 리얼 기준 나머지 정상 요청은 1% 샘플링
- 추적 적재 기간은 1주
Metric
- 메트릭 적재 기간은 2주
- 메트릭 주기는 10초